UGC NET CS 2010 June-Paper-2
October 24, 2023GATE 2007
October 24, 2023DSSSB TGT 2017
|
Question 37
|
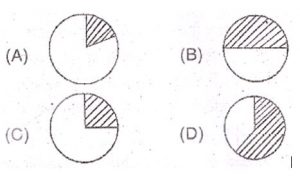
If 6% of the population of Rampur is post-graduate and 19% are plain graduates, then which diagram best represents the proportion of graduates as shaded portion
|
A
|
|
|
B
|
|
|
C
|
|
|
D
|
Correct Answer: C