Transactions
April 2, 2024UGC NET CS 2017 Jan -paper-2
April 3, 2024Question 7060 – Data-Interpretation
Consider the following table that shows the number (in lakhs) of different sizes of LED television sets by a company over the last seven years from 2012 to 2018. Answer the questions based on the data contained in the table:
Sales of LED Television sets(in lakhs) of different sizes(in inches)
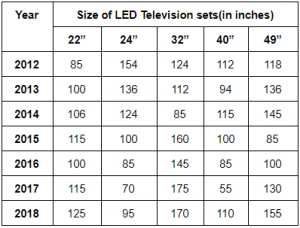
What was the approximate percentage increase/decrease in the sales of 32-inch LED television sets in 2017 compared to that in 2013?
Correct Answer: B
Question 126 Explanation:
The total sales of 40’’ inches T.V. in 2013 is 112lacs
The total sales of 32’’ inches T.V. in 2017 is 175
The percentage of increase in sales =(175-112)/112=56.25(which is equivalent to 56)
The total sales of 32’’ inches T.V. in 2017 is 175
The percentage of increase in sales =(175-112)/112=56.25(which is equivalent to 56)
36%
56%
57%
64%