Algorithms
October 12, 2023Data-Structures
October 12, 2023GATE 2021 CS-Set-2
|
Question 6
|

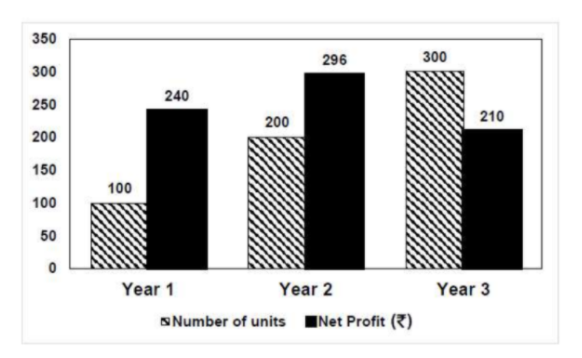
The number of units of a product sold in three different years and the respective net profits are presented in the figure above. The cost/unit in Year 3 was ₹ 1, which was half the cost/unit in Year 2. The cost/unit in Year 3 was one-third of the cost/unit in Year 1. Taxes were paid on the selling price at 10%, 13% and 15% respectively for the three years. Net profit is calculated as the difference between the selling price and the sum of cost and taxes paid in that year.
The ratio of the selling price in Year 2 to the selling price in Year 3 is ______.
|
1:1
|
|
|
3:4
|
|
|
1:2
|
|
|
4:3
|
According to the given data:
Year Cost/unit Number of units Cost Price
1 ₹ 3 100 300
2 ₹ 2 200 400
3 ₹ 1 300 300
Cost Price = Cost/unit x Number of units
Net Profit = Selling Price – (Cost Price + (Tax% x selling price )
Year 2:
296 = SP – (400 + (13/100) x SP)
=>296 = 0.87SP – 400
=> 0.87SP = 696
=> SP = ₹ 800
Year 3:
210 = SP – (300 + (15/100) x SP)
=> 210 = 0.85SP – 300
=> 0.85SP = 510
=> SP = ₹ 600
The ratio of selling price in Year 2 to the selling price in year 3 = 800:600
= 4:3
