
Computer-Networks
January 8, 2024NTA UGC NET Dec 2023 Paper-1
January 8, 2024NTA UGC NET Dec 2023 Paper-1
| Question 2 |
The following table shows the number of building constructed in six different towns A-F of a state S over the seven years from 2016-2022. Based on the data in the table, answer the questions that follow.
Town-wise Details of buildings Constructed.
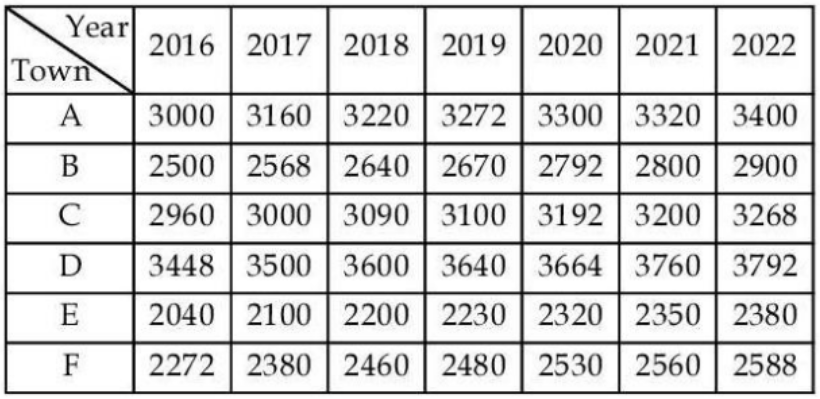
Q2: What is the percentage increase in the number of buildings constructed in Town D in 2018 with reference to the previous year?
Town-wise Details of buildings Constructed.
Q2: What is the percentage increase in the number of buildings constructed in Town D in 2018 with reference to the previous year?
| 3.85 | |
| 2.85 | |
| 4.85 | |
| 4 |
Question 2 Explanation:
Number of buildings constructed in Town D in 2017: 3500 (from the “2017” column for Town D)
Number of buildings constructed in Town D in 2018: 3600 (from the “2018” column for Town D)
Percentage Increase = ((3600 – 3500) / 3500) * 100% = 4%
Therefore, the number of buildings constructed in Town D increased by 4% from 2017 to 2018.
Number of buildings constructed in Town D in 2018: 3600 (from the “2018” column for Town D)
Percentage Increase = ((3600 – 3500) / 3500) * 100% = 4%
Therefore, the number of buildings constructed in Town D increased by 4% from 2017 to 2018.
Correct Answer: D
Question 2 Explanation:
Number of buildings constructed in Town D in 2017: 3500 (from the “2017” column for Town D)
Number of buildings constructed in Town D in 2018: 3600 (from the “2018” column for Town D)
Percentage Increase = ((3600 – 3500) / 3500) * 100% = 4%
Therefore, the number of buildings constructed in Town D increased by 4% from 2017 to 2018.
Number of buildings constructed in Town D in 2018: 3600 (from the “2018” column for Town D)
Percentage Increase = ((3600 – 3500) / 3500) * 100% = 4%
Therefore, the number of buildings constructed in Town D increased by 4% from 2017 to 2018.