NTA UGC NET Dec 2023 Paper-1
January 8, 2024NTA UGC NET Dec 2023 Paper-1
January 8, 2024NTA UGC NET Dec 2023 Paper-1
|
Question 1
|
The following table shows the number of building constructed in six different towns A-F of a state S over the seven years from 2016-2022. Based on the data in the table, answer the questions that follow.
Town-wise Details of buildings Constructed.
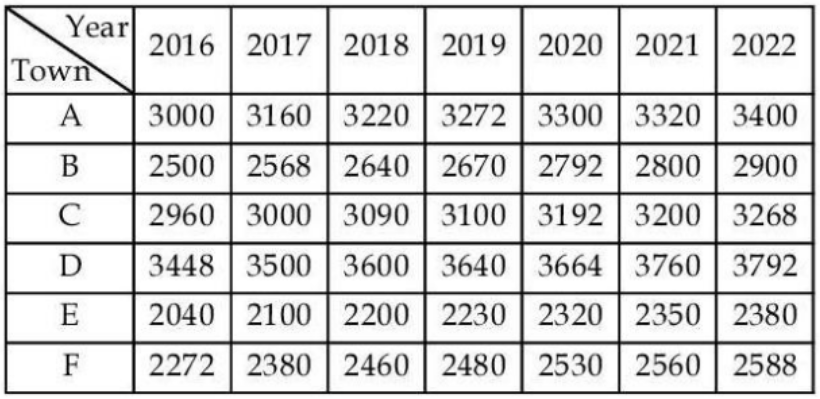
Q1: Across the state S, the total number of buildings constructed in 2016 is approximately _____ % of the total number of buildings constructed in 2018?
Town-wise Details of buildings Constructed.
Q1: Across the state S, the total number of buildings constructed in 2016 is approximately _____ % of the total number of buildings constructed in 2018?
|
81
|
|
|
94
|
|
|
84
|
|
|
74
|
Question 1 Explanation:
Total buildings in 2016: Sum the values in the “2016” column for all towns (A-F): 3000 + 2500 + 2960 + 3448 + 2040 + 2272 = 16220
Total buildings in 2018: Sum the values in the “2018” column for all towns (A-F): 3220 + 2640 + 3090 + 3600 + 2200 + 2460 = 17110
Percentage of 2016 buildings in 2018: (16220 / 17110) * 100% ≈ 94.7
Total buildings in 2018: Sum the values in the “2018” column for all towns (A-F): 3220 + 2640 + 3090 + 3600 + 2200 + 2460 = 17110
Percentage of 2016 buildings in 2018: (16220 / 17110) * 100% ≈ 94.7
Correct Answer: B
Question 1 Explanation:
Total buildings in 2016: Sum the values in the “2016” column for all towns (A-F): 3000 + 2500 + 2960 + 3448 + 2040 + 2272 = 16220
Total buildings in 2018: Sum the values in the “2018” column for all towns (A-F): 3220 + 2640 + 3090 + 3600 + 2200 + 2460 = 17110
Percentage of 2016 buildings in 2018: (16220 / 17110) * 100% ≈ 94.7
Total buildings in 2018: Sum the values in the “2018” column for all towns (A-F): 3220 + 2640 + 3090 + 3600 + 2200 + 2460 = 17110
Percentage of 2016 buildings in 2018: (16220 / 17110) * 100% ≈ 94.7