ISRO CS 2011
September 25, 2024GATE 2022
September 25, 2024GATE 2019
|
Question 10
|
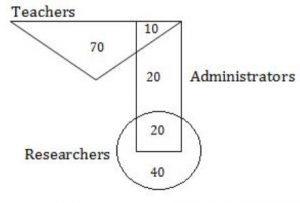
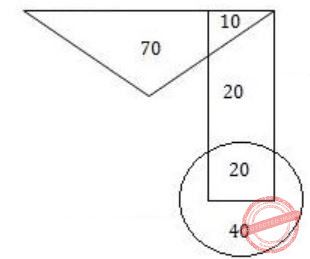
In the given diagram, teachers are represented in the triangle, researchers in the circle and administrators in the rectangle. Out of the total number of the people, the percentage of administrators shall be in the range of _____.
|
16 to 30
|
|
|
0 to 15
|
|
|
46 to 60
|
|
|
31 to 45
|
Question 10 Explanation:
From the given diagram:
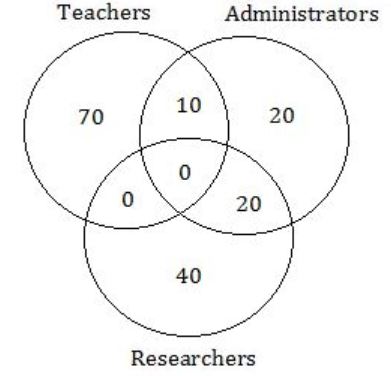
Total no. of people = 70 + 10 + 20 + 20 + 40 = 160
No. of Administrators = 50
% of Administrators = 50/160 = 31.25
Correct Answer: D
Question 10 Explanation:
From the given diagram:
Total no. of people = 70 + 10 + 20 + 20 + 40 = 160
No. of Administrators = 50
% of Administrators = 50/160 = 31.25