Data-Interpretation
October 11, 2023Compiler-Design
October 11, 2023Aptitude
|
Question 4
|
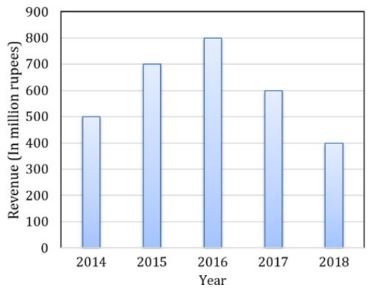
The total revenue of a company during 2014-2018 is shown in the bar graph. If the total expenditure of the company in each year is 500 million rupees, then the aggregate profit or loss (in percentage) on the total expenditure of the company during 2014-2018 is ______.
|
20% profit
|
|
|
20% loss
|
|
|
16.67% loss
|
|
|
16.67% profit
|
Question 4 Explanation:
Bar-graph:
2014-2018
Total expenditure = 500 million/year = 500 × 5 = 2500 million
Revenue total (from the graph)
= 400 + 500 + 600 + 700 + 800
= 3000 million
Profit = 3000 – 2500 = 500
⟹ 500/2500 = 20% profit
2014-2018
Total expenditure = 500 million/year = 500 × 5 = 2500 million
Revenue total (from the graph)
= 400 + 500 + 600 + 700 + 800
= 3000 million
Profit = 3000 – 2500 = 500
⟹ 500/2500 = 20% profit
Correct Answer: A
Question 4 Explanation:
Bar-graph:
2014-2018
Total expenditure = 500 million/year = 500 × 5 = 2500 million
Revenue total (from the graph)
= 400 + 500 + 600 + 700 + 800
= 3000 million
Profit = 3000 – 2500 = 500
⟹ 500/2500 = 20% profit
2014-2018
Total expenditure = 500 million/year = 500 × 5 = 2500 million
Revenue total (from the graph)
= 400 + 500 + 600 + 700 + 800
= 3000 million
Profit = 3000 – 2500 = 500
⟹ 500/2500 = 20% profit