NTA UGC NET Dec 2023 Paper-1
January 8, 2024NTA UGC NET Dec 2023 Paper-1
January 8, 2024NTA UGC NET Dec 2023 Paper-1
|
Question 3
|
The following table shows the number of building constructed in six different towns A-F of a state S over the seven years from 2016-2022. Based on the data in the table, answer the questions that follow.
Town-wise Details of buildings Constructed.
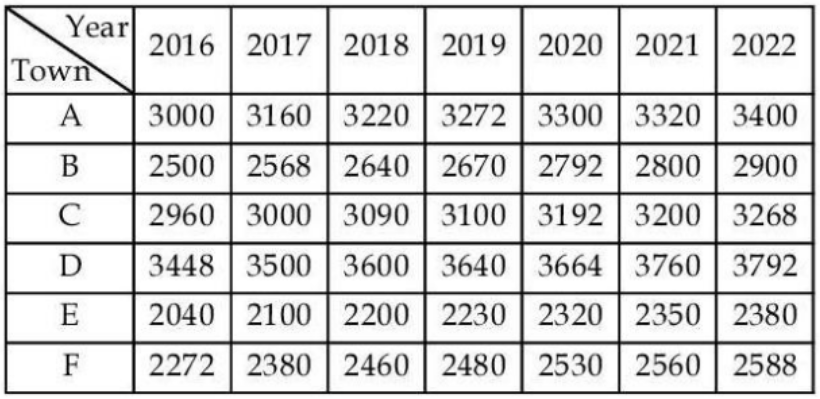
Q3: In the context of towns E and F together, what is the difference between the number of buildings constructed in 2021 and that in 2017?
Town-wise Details of buildings Constructed.
Q3: In the context of towns E and F together, what is the difference between the number of buildings constructed in 2021 and that in 2017?
|
630
|
|
|
830
|
|
|
430
|
|
|
410
|
Question 3 Explanation:
Number of buildings in towns E and F in 2021: 2350 (from Town E) + 2560 (from Town F) = 4910
Number of buildings in towns E and F in 2017: 2100 (from Town E) + 2380 (from Town F) = 4480
Difference in number of buildings: 4910 (2021) – 4480 (2017) = 430
Number of buildings in towns E and F in 2017: 2100 (from Town E) + 2380 (from Town F) = 4480
Difference in number of buildings: 4910 (2021) – 4480 (2017) = 430
Correct Answer: C
Question 3 Explanation:
Number of buildings in towns E and F in 2021: 2350 (from Town E) + 2560 (from Town F) = 4910
Number of buildings in towns E and F in 2017: 2100 (from Town E) + 2380 (from Town F) = 4480
Difference in number of buildings: 4910 (2021) – 4480 (2017) = 430
Number of buildings in towns E and F in 2017: 2100 (from Town E) + 2380 (from Town F) = 4480
Difference in number of buildings: 4910 (2021) – 4480 (2017) = 430