Data-Interpretation
Question 1 |
Comprehension
The following table shows the total number of students in the Department of the Institute along with the percentage of Females and Male students. Answer questions 1 to 5 based on the data given below:
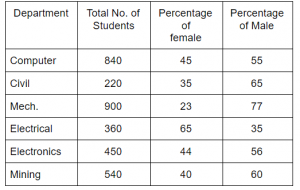
What is the ratio of the number of females in Civil and Electrical departments together to the number of males in the same Departments together?
The following table shows the total number of students in the Department of the Institute along with the percentage of Females and Male students. Answer questions 1 to 5 based on the data given below:
What is the ratio of the number of females in Civil and Electrical departments together to the number of males in the same Departments together?
311 : 270 | |
329 : 261 | |
411 : 469 | |
311 : 269
|
Question 1 Explanation:
Number of females in civil department is (35/100)*220 = 77
Number of females in electrical department is (65/100)*360 = 234
Total number of female students(civil+electrical)=77+234=311
Number of males in civil department is (65/100)*220 = 143
Number of males in electrical department is (35/100)*360 = 126
Total number of male students(civil+electrical)=143+126=269
The ratio of the number of females in Civil and Electrical departments together to the number of males in the same Departments together is 311 : 269
Question 2 |
Comprehension
The following table shows the total number of students in the Department of the Institute along with the percentage of Females and Male students. Answer questions 1 to 5 based on the data given below:
What is the average percentage of female students in the whole Institute?
The following table shows the total number of students in the Department of the Institute along with the percentage of Females and Male students. Answer questions 1 to 5 based on the data given below:
What is the average percentage of female students in the whole Institute?
42.0%
| |
41.0%
| |
43.0% | |
41.5%
|
Question 2 Explanation:
Average percentage of female students in the whole institute =45+35+23+65+44+40
Total female students percentage=252
Average= (252%6) = 42%
Total female students percentage=252
Average= (252%6) = 42%
Question 3 |
Comprehension
The following table shows the total number of students in the Department of the Institute along with the percentage of Females and Male students. Answer questions 1 to 5 based on the data given below:
What is the respective ratio of the number of females in the Mechanical Department to the number of females in the Electronics Department?
4 : 3
| |
23 : 22
| |
24 : 21 | |
23 : 21
|
Question 3 Explanation:
Number of females in the Mechanical Department is (23%100)*900 = 207
Number of females in the Electronics Department= (44%100)*450 = 198
Ration=207:198=23:22
Number of females in the Electronics Department= (44%100)*450 = 198
Ration=207:198=23:22
Question 4 |
Comprehension
The following table shows the total number of students in the Department of the Institute along with the percentage of Females and Male students. Answer questions 1 to 5 based on the data given below:
What is the total number of students in all the Departments?
The following table shows the total number of students in the Department of the Institute along with the percentage of Females and Male students. Answer questions 1 to 5 based on the data given below:
What is the total number of students in all the Departments?
2210 | |
3210 | |
3400 | |
3310 |
Question 4 Explanation:
Total number of students in all the Departments = 840 + 220 + 900 + 360 + 450 + 540= 3310
Question 5 |
Comprehension
The following table shows the total number of students in the Department of the Institute along with the percentage of Females and Male students. Answer questions 1 to 5 based on the data given below:
What is the total number of male students in the Computer and Mining Department together?
The following table shows the total number of students in the Department of the Institute along with the percentage of Females and Male students. Answer questions 1 to 5 based on the data given below:
What is the total number of male students in the Computer and Mining Department together?
266 | |
886 | |
786 | |
686 |
Question 5 Explanation:
Total number of male students in the Computer Department is (55/100)*840 = 462
Total number of male students in the Mining Department is is (60/100)*540 = 324
Total number of male students in the Computer and Mining Department together is 462+ 324= 786
Total number of male students in the Mining Department is is (60/100)*540 = 324
Total number of male students in the Computer and Mining Department together is 462+ 324= 786
Question 6 |
Directions for question number 38 to 42:
Answer the questions on the basis of the following information provided:
The students of a school participates in various sports activities, the distribution of the same is given below:
Football - 17%
Handball - 26%
Badminton - 16%
Table Tennis - 22%
Basketball - 19%
Total number of students in the school are 800.
Q38. What is the respective ratio between the total number of students taking part in Badminton and Table Tennis together and those participating in Basketball and Football together?
11 : 13 | |
18 : 19 | |
19 : 18 | |
29 : 28 |
Question 6 Explanation:
Total number of students taking part in Badminton and Table Tennis together is =(0.16*800 + 0.22*800)
= 304
Total number of students taking part in Basketball and Football together is = (0.19*800 + 0.17*800)
=288
Ration= 304/16=19 : 288/16= 18
= 304
Total number of students taking part in Basketball and Football together is = (0.19*800 + 0.17*800)
=288
Ration= 304/16=19 : 288/16= 18
Question 7 |
Directions for question number 38 to 42:
Answer the questions on the basis of the following information provided:
The students of a school participates in various sports activities, the distribution of the same is given below:
Football - 17%
Handball - 26%
Badminton - 16%
Table Tennis - 22%
Basketball - 19%
Total number of students in the school are 800.
What is the number of girls who take part in handball, if the ratio of boys to girls is 3 : 10 respectively?
48 | |
80 | |
78 | |
160 |
Question 7 Explanation:
Total number of students in handball is 208
Ration is 3:10
48: 160
Boys = 48 and girls = 160
Ration is 3:10
48: 160
Boys = 48 and girls = 160
Question 8 |
Directions for question number 38 to 42:
Answer the questions on the basis of the following information provided:
The students of a school participates in various sports activities, the distribution of the same is given below:
Football - 17%
Handball - 26%
Badminton - 16%
Table Tennis - 22%
Basketball - 19%
Total number of students in the school are 800.
The number of students taking part in Basketball is approximately what percent more than those taking part in Football?
10.84% | |
9.92% | |
9.32% | |
None of the options |
Question 8 Explanation:
Y is what percentage more than X= Y-X/X * 100
Basketball is approximately what percent more than those taking part in Football = ((19-17) /17) *100.
Basketball is approximately what percent more than those taking part in Football = ((19-17) /17) *100.
Question 9 |
Directions for question number 38 to 42:
Answer the questions on the basis of the following information provided:
The students of a school participates in various sports activities, the distribution of the same is given below:
Football - 17%
Handball - 26%
Badminton - 16%
Table Tennis - 22%
Basketball - 19%
Total number of students in the school are 800.
If out of the number of students in Basketball, 69 are girls, what is the difference between the number of boys and girls taking part in Basketball?
17 | |
23 | |
86 | |
14 |
Question 9 Explanation:
Total number of Basket students = 152
Girls= 69
Boys= 152-69= 83
Difference= 83-69 = 14
Girls= 69
Boys= 152-69= 83
Difference= 83-69 = 14
Question 10 |
Directions for question number 38 to 42:
Answer the questions on the basis of the following information provided:
The students of a school participates in various sports activities, the distribution of the same is given below:
Football - 17%
Handball - 26%
Badminton - 16%
Table Tennis - 22%
Basketball - 19%
Total number of students in the school are 800.
What is the approximate average of the number of participants in Handball, Badminton and Basketball?
162 | |
163 | |
104 | |
169 |
Question 10 Explanation:
Total number of Basket students = 152
Total number of students in handball = 208
Total number of students in Badminton= 128
=(152+208+128)/3
=488/3
=162.66
Total number of students in handball = 208
Total number of students in Badminton= 128
=(152+208+128)/3
=488/3
=162.66
Question 11 |
Directions for question number 3 to 7:
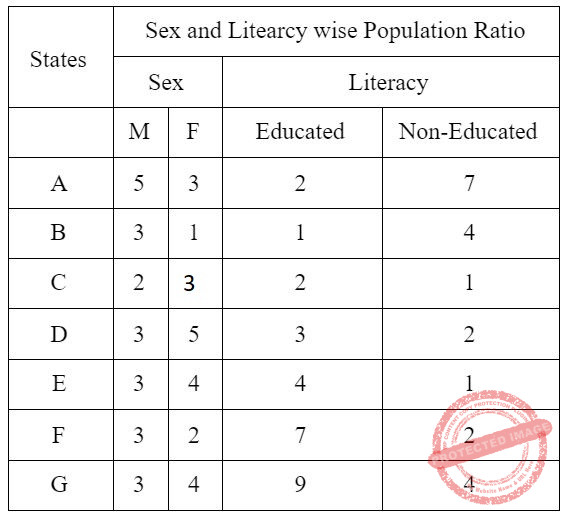
Study the following and the table and answer the questions given below. (Data of different states regarding population of states in the year 2018)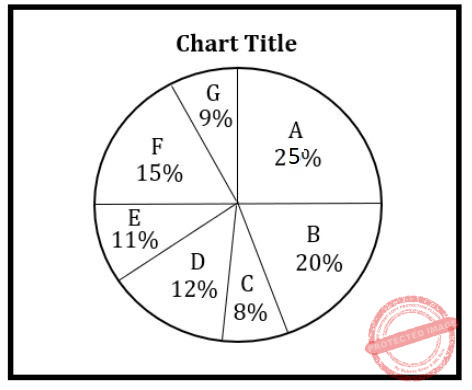
Total population of the given States = 3276000
Q3. If in the year 2018, population of F is increased by 10% and population of B is increased by 12% as compared to the previous year, then ______ is the ratio of population of F and B in 2017.
42 : 55 | |
62 : 55 | |
42 : 11 | |
44 : 5 |
Question 11 Explanation:
F 2018 = (15/100)*3276000
B 2018 = (20/100)*3276000
F increased by 10% in 2018.
B increases by 12% in 2018.
So, F 2017→ 1.1 times= 15*32760
B 2017→ 1.12 times = 20*32760
F 2017 : B2017 = [(15*3276)*10]/11 : [(20*32760)*100]/112
= 42:55
B 2018 = (20/100)*3276000
F increased by 10% in 2018.
B increases by 12% in 2018.
So, F 2017→ 1.1 times= 15*32760
B 2017→ 1.12 times = 20*32760
F 2017 : B2017 = [(15*3276)*10]/11 : [(20*32760)*100]/112
= 42:55
Question 12 |
Directions for question number 3 to 7:
Study the following and the table and answer the questions given below. (Data of different states regarding population of states in the year 2018)
Total population of the given States = 3276000
Q4. _______ is the percentage of total number of males in F, B and D together to the total population of all the given states.
24% | |
17.5% | |
28.5% | |
29.5% |
Question 12 Explanation:
Let population=X
Males of F in 2018 = (⅗)*15*(X/100) = 9X/100
Males of B in 2018 = (¾)*20*(X/100) = 15X/100
Males of D in 2018 = (⅜)*12*(X/100)=4.5X/100
Total=(28.5*X)/100
X=28.5%
Males of F in 2018 = (⅗)*15*(X/100) = 9X/100
Males of B in 2018 = (¾)*20*(X/100) = 15X/100
Males of D in 2018 = (⅜)*12*(X/100)=4.5X/100
Total=(28.5*X)/100
X=28.5%
Question 13 |
Directions for question number 3 to 7:
Study the following and the table and answer the questions given below. (Data of different states regarding population of states in the year 2018)
Total population of the given States = 3276000
Q5. The number of males in F in the year 2018 is ______.
Study the following and the table and answer the questions given below. (Data of different states regarding population of states in the year 2018)
Total population of the given States = 3276000
Q5. The number of males in F in the year 2018 is ______.
294650 | |
294840 | |
301470 | |
301200 |
Question 13 Explanation:
Males of F in 2018 = (9X/100) = (9/100)*3276000
=10’s digit is 4
So, Option-B is correct.
=10’s digit is 4
So, Option-B is correct.
Question 14 |
Directions for question number 3 to 7:
Study the following and the table and answer the questions given below. (Data of different states regarding population of states in the year 2018)
Total population of the given States = 3276000
Q6. _____ is the ratio of the number of females in G to the number of females in C.
Study the following and the table and answer the questions given below. (Data of different states regarding population of states in the year 2018)
Total population of the given States = 3276000
Q6. _____ is the ratio of the number of females in G to the number of females in C.
16 : 5 | |
16 : 7 | |
15 : 11 | |
15 : 14 |
Question 14 Explanation:
=327600*9*(4/7) : 327600*8*(3/5)
=(9*4)/7 * 5/(8*3)
= 15:14
=(9*4)/7 * 5/(8*3)
= 15:14
Question 15 |
Directions for question number 3 to 7:
Study the following and the table and answer the questions given below. (Data of different states regarding population of states in the year 2018)
Total population of the given States = 3276000
Q7. _____ is the total number of non-educated people in A and B in 2018.
Study the following and the table and answer the questions given below. (Data of different states regarding population of states in the year 2018)
Total population of the given States = 3276000
Q7. _____ is the total number of non-educated people in A and B in 2018.
1276040 | |
1032170 | |
1081550 | |
1161160 |
Question 15 Explanation:
Non educated people= A 2018 + B 2018
= (7/9) * (25X/100) + ⅘ * (20X / 100) * 9/9
= 1161160
= (7/9) * (25X/100) + ⅘ * (20X / 100) * 9/9
= 1161160
Question 16 |
The following table shows the cumulative percentage of the total number of students appearing in the Hindi and Punjabi examinations and the cumulative number of students appearing in the Hindi examination and scoring marks in five different categories, namely, 80 and above; 70 and above; 60 and above; 50 and above; and 40 and above. Based on the data in the table, answer the questions that follow.
Mark-wise distribution of students
Notes:
What is the sum of the number of students who scored 70 or more than 70 but less than 80 marks in Hindi and the number of students who scored 80 or more than 80 marks in Punjabi?
Mark-wise distribution of students
| Marks (Out of 100) | Cumulative Percentage of Total Number of Students (who appeared in Hindi & Punjabi) | Cumulative Number of Students Who Appeared in Hindi |
| 80 and above | 15% | 108 |
| 70 and above | 35% | 264 |
| 60 and above | 65% | 424 |
| 50 and above | 90% | 554 |
| 40 and above | 100% | 624 |
Notes:
- Total number of students who attended the exam is 1200.
- No student failed in the examination.
- Each student appeared in only one exam, i.e., either in Hindi or Punjabi.
What is the sum of the number of students who scored 70 or more than 70 but less than 80 marks in Hindi and the number of students who scored 80 or more than 80 marks in Punjabi?
330
| |
228 | |
272
| |
284 |
Question 17 |
The following table shows the cumulative percentage of the total number of students appearing in the Hindi and Punjabi examinations and the cumulative number of students appearing in the Hindi examination and scoring marks in five different categories, namely, 80 and above; 70 and above; 60 and above; 50 and above; and 40 and above. Based on the data in the table, answer the questions that follow.
Mark-wise distribution of students
Notes:
What is the ratio of the number of students who scored 50 or more than 50 marks but less than 60 marks in Hindi to the number of students who scored 40 or more than 40 marks but less than 50 marks in Punjabi?
Mark-wise distribution of students
| Marks (Out of 100) | Cumulative Percentage of Total Number of Students (who appeared in Hindi & Punjabi) | Cumulative Number of Students Who Appeared in Hindi |
| 80 and above | 15% | 108 |
| 70 and above | 35% | 264 |
| 60 and above | 65% | 424 |
| 50 and above | 90% | 554 |
| 40 and above | 100% | 624 |
Notes:
- Total number of students who attended the exam is 1200.
- No student failed in the examination.
- Each student appeared in only one exam, i.e., either in Hindi or Punjabi.
What is the ratio of the number of students who scored 50 or more than 50 marks but less than 60 marks in Hindi to the number of students who scored 40 or more than 40 marks but less than 50 marks in Punjabi?
12 : 11
| |
8 : 7
| |
3 : 1
| |
13 : 5
|
Question 18 |
The following table shows the cumulative percentage of the total number of students appearing in the Hindi and Punjabi examinations and the cumulative number of students appearing in the Hindi examination and scoring marks in five different categories, namely, 80 and above; 70 and above; 60 and above; 50 and above; and 40 and above. Based on the data in the table, answer the questions that follow.
Mark-wise distribution of students
Notes:
The number of students who scored 80 and above marks in Hindi is ___% less than the number of students who scored 60 or more than 60 marks but less than 70 marks in Punjabi.
Mark-wise distribution of students
| Marks (Out of 100) | Cumulative Percentage of Total Number of Students (who appeared in Hindi & Punjabi) | Cumulative Number of Students Who Appeared in Hindi |
| 80 and above | 15% | 108 |
| 70 and above | 35% | 264 |
| 60 and above | 65% | 424 |
| 50 and above | 90% | 554 |
| 40 and above | 100% | 624 |
Notes:
- Total number of students who attended the exam is 1200.
- No student failed in the examination.
- Each student appeared in only one exam, i.e., either in Hindi or Punjabi.
The number of students who scored 80 and above marks in Hindi is ___% less than the number of students who scored 60 or more than 60 marks but less than 70 marks in Punjabi.
46 | |
54 | |
44 | |
52 |
Question 19 |
The following table shows the cumulative percentage of the total number of students appearing in the Hindi and Punjabi examinations and the cumulative number of students appearing in the Hindi examination and scoring marks in five different categories, namely, 80 and above; 70 and above; 60 and above; 50 and above; and 40 and above. Based on the data in the table, answer the questions that follow.
Mark-wise distribution of students
Notes:
What is the difference between the number of students who scored 70 or more than 70 marks but less than 80 marks in Punjabi and the number of students who scored 40 or more than 40 marks but less than 50 marks in Hindi?
Mark-wise distribution of students
| Marks (Out of 100) | Cumulative Percentage of Total Number of Students (who appeared in Hindi & Punjabi) | Cumulative Number of Students Who Appeared in Hindi |
| 80 and above | 15% | 108 |
| 70 and above | 35% | 264 |
| 60 and above | 65% | 424 |
| 50 and above | 90% | 554 |
| 40 and above | 100% | 624 |
Notes:
- Total number of students who attended the exam is 1200.
- No student failed in the examination.
- Each student appeared in only one exam, i.e., either in Hindi or Punjabi.
What is the difference between the number of students who scored 70 or more than 70 marks but less than 80 marks in Punjabi and the number of students who scored 40 or more than 40 marks but less than 50 marks in Hindi?
20 | |
16 | |
14 | |
30 |
Question 20 |
The following table shows the cumulative percentage of the total number of students appearing in the Hindi and Punjabi examinations and the cumulative number of students appearing in the Hindi examination and scoring marks in five different categories, namely, 80 and above; 70 and above; 60 and above; 50 and above; and 40 and above. Based on the data in the table, answer the questions that follow.
Mark-wise distribution of students
Notes:
What is the average of the number of students who scored 50 or more than 50 marks but less than 60 marks in Punjabi and the number of students who scored 50 or more than 50 marks but less than 60 marks in Hindi?
Mark-wise distribution of students
| Marks (Out of 100) | Cumulative Percentage of Total Number of Students (who appeared in Hindi & Punjabi) | Cumulative Number of Students Who Appeared in Hindi |
| 80 and above | 15% | 108 |
| 70 and above | 35% | 264 |
| 60 and above | 65% | 424 |
| 50 and above | 90% | 554 |
| 40 and above | 100% | 624 |
Notes:
- Total number of students who attended the exam is 1200.
- No student failed in the examination.
- Each student appeared in only one exam, i.e., either in Hindi or Punjabi.
What is the average of the number of students who scored 50 or more than 50 marks but less than 60 marks in Punjabi and the number of students who scored 50 or more than 50 marks but less than 60 marks in Hindi?
180 | |
150 | |
200 | |
140 |
Question 21 |
The following table shows the proportion of students passed in three different Graduation Streams, namely, Arts, Science and Commerce, from seven different cities A-G, along with the ratio of Males (M) to Females (F) for the three streams among the students. Based on the data in the table, answer the questions that follow.
City-wise details of Graduating students
The number of males who passed in Commerce from City-F is approximately __________% more than the number of females who passed in Commerce from City-F.
City-wise details of Graduating students
The number of males who passed in Commerce from City-F is approximately __________% more than the number of females who passed in Commerce from City-F.
31.25
| |
47.47 | |
45.45 | |
42.67 |
Question 22 |
The following table shows the proportion of students passed in three different Graduation Streams, namely, Arts, Science and Commerce, from seven different cities A-G, along with the ratio of Males (M) to Females (F) for the three streams among the students. Based on the data in the table, answer the questions that follow.
City-wise details of Graduating students
For City-A, if the total number of males who passed in Arts is 2480, then what is the difference between the number of students who passed in Commerce and that in Science ?
City-wise details of Graduating students
For City-A, if the total number of males who passed in Arts is 2480, then what is the difference between the number of students who passed in Commerce and that in Science ?
600 | |
1000 | |
1400 | |
1800 |
Question 23 |
The following table shows the proportion of students passed in three different Graduation Streams, namely, Arts, Science and Commerce, from seven different cities A-G, along with the ratio of Males (M) to Females (F) for the three streams among the students. Based on the data in the table, answer the questions that follow.
City-wise details of Graduating students
If the number of students who passed in Commerce from City-F is 3240, then the number of students who passed from City-F is _________% of the number of Science students who passed from City-F.
City-wise details of Graduating students
If the number of students who passed in Commerce from City-F is 3240, then the number of students who passed from City-F is _________% of the number of Science students who passed from City-F.
75 | |
150 | |
180 | |
225 |
Question 24 |
The following table shows the proportion of students passed in three different Graduation Streams, namely, Arts, Science and Commerce, from seven different cities A-G, along with the ratio of Males (M) to Females (F) for the three streams among the students. Based on the data in the table, answer the questions that follow.
City-wise details of Graduating students
If the number of females who passed in Arts from City-C is 768, then the number of males who passed in Commerce from City-C is approximately ___________% of the number of students who passed from city-C.
City-wise details of Graduating students
If the number of females who passed in Arts from City-C is 768, then the number of males who passed in Commerce from City-C is approximately ___________% of the number of students who passed from city-C.
14.76 | |
18.24 | |
27.8 | |
32.5 |
Question 25 |
The following table shows the proportion of students passed in three different Graduation Streams, namely, Arts, Science and Commerce, from seven different cities A-G, along with the ratio of Males (M) to Females (F) for the three streams among the students. Based on the data in the table, answer the questions that follow.
City-wise details of Graduating students
If the number of males who passed in Commerce from City-G is 2544, then what is the number of students who passed in Arts from City-G ?
City-wise details of Graduating students
If the number of males who passed in Commerce from City-G is 2544, then what is the number of students who passed in Arts from City-G ?
3600 | |
4200 | |
4800 | |
3400 |
Question 26 |
The following table shows the percentage (%) distribution of total number of students and total number of girls studying in six colleges A-F. Total number of students and girls studying in all the colleges together are 60000 and 24000 respectively. Based on the data in the table, answer the questions
College-wise Distribution of Students
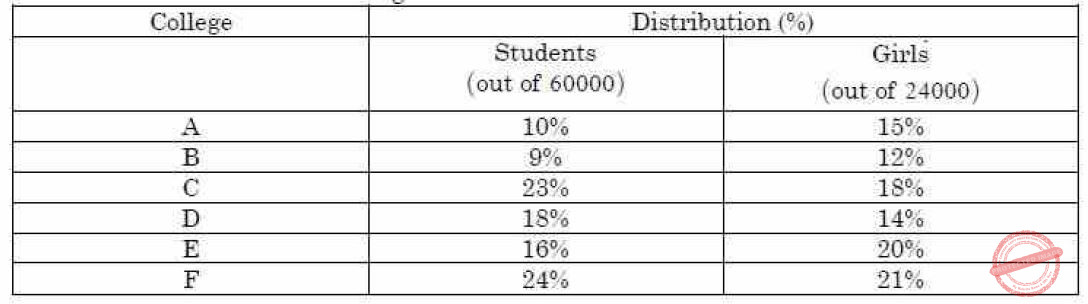
The ratio of the number of boys in College F with the number of boys in college D is
College-wise Distribution of Students
The ratio of the number of boys in College F with the number of boys in college D is
31:39
| |
39:31
| |
29:37
| |
37:29 |
Question 27 |
The following table shows the percentage (%) distribution of total number of students and total number of girls studying in six colleges A-F.Total number of students and girls studying in all the colleges together are 60000 and 24000 respectively. Based on the data in the table, answer the questions
College-wise Distribution of Students
The number of girls in College F is ____ % more than the number of girls in College A
The number of girls in College F is ____ % more than the number of girls in College A
25 | |
30 | |
40 | |
50 |
Question 28 |
The following table shows the percentage (%) distribution of total number of students and total number of girls studying in six colleges A-F.Total number of students and girls studying in all the colleges together are 60000 and 24000 respectively. Based on the data in the table, answer the questions
College-wise Distribution of Students
The difference between the number of boys and number of girls studying in College D is
The difference between the number of boys and number of girls studying in College D is
4040
| |
4080
| |
7440
| |
3360 |
Question 29 |
The following table sh0ws the percentage (%) distribution of total number of students and total number of girls studying in six colleges A-F.Total number of students and girls studying in all the colleges together are 60000 and 24000 respectively. Based on the data in the table, answer the questions
College-wise Distribution of Students
The average of the number of boys studying in Collegs A,B and C is
The average of the number of boys studying in Collegs A,B and C is
4900
| |
4700
| |
4400
| |
4800 |
Question 30 |
The following table shows the percentage (%) distribution of total number of students and total number of girls studying in six colleges A-F.Total number of students and girls studying in all the colleges together are 60000 and 24000 respectively. Based on the data in the table, answer the questions
College-wise Distribution of Students
The number of girl students studying in College C as a percentage of the number of boys studying in College E is
The number of girl students studying in College C as a percentage of the number of boys studying in College E is
70% | |
75% | |
80% | |
90% |
Question 31 |
Study the following graph carefully and answer Q.No. 44 to 49 given below it :
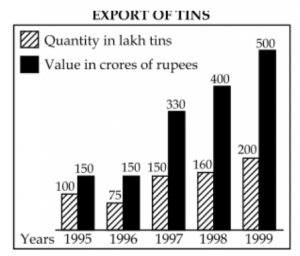
In which year the value per tin was minimum ?
In which year the value per tin was minimum ?
1995 | |
1996 | |
1998 | |
1999 |
Question 32 |
Study the following graph carefully and answer Q.No. 44 to 49 given below it :
What was the difference between the tins exported in 1997 and 1998 ?
What was the difference between the tins exported in 1997 and 1998 ?
10 | |
1000 | |
100000 | |
1000000 |
Question 33 |
Study the following graph carefully and answer Q.No. 44 to 49 given below it :
What was the approximate percentage increase in export value from 1995 to 1999 ?
What was the approximate percentage increase in export value from 1995 to 1999 ?
350 | |
330.3 | |
433.3 | |
None of these |
Question 34 |
Study the following graph carefully and answer Q.No. 44 to 49 given below it :
What was the percentage drop in export quantity from 1995 to 1996 ?
What was the percentage drop in export quantity from 1995 to 1996 ?
75 | |
50 | |
25 | |
None of these |
Question 35 |
Study the following graph carefully and answer Q.No. 44 to 49 given below it :
If in 1998, the tins were exported at the same rate per tin as that in 1997, what would be the value (in crores of rupees) of export in 1998 ?
If in 1998, the tins were exported at the same rate per tin as that in 1997, what would be the value (in crores of rupees) of export in 1998 ?
400 | |
375 | |
352 | |
330 |
Question 36 |
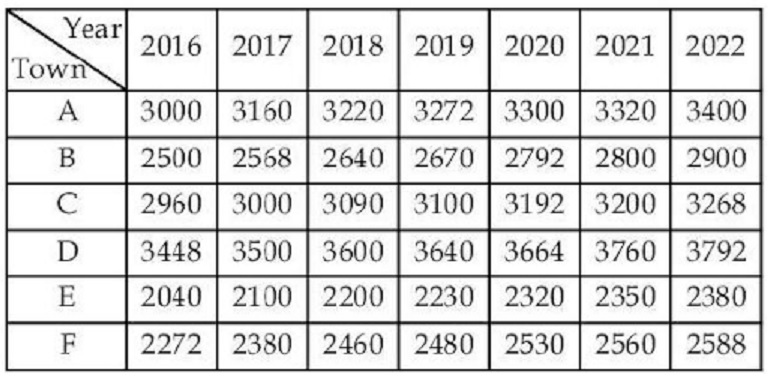
Answer the question 1 to 5 based on the data given in the table below.
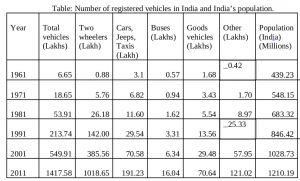
What was the per capita ownership of two wheelers in India in the year 2011?
What was the per capita ownership of two wheelers in India in the year 2011?
~0.0084% | |
~0.84% | |
~0.068% | |
~0.084% | |
None of the Above |
Question 37 |
Answer the question 1 to 5 based on the data given in the table below.
What was the average decadal growth in the number of cars during 1961 – 2011?
What was the average decadal growth in the number of cars during 1961 – 2011?
~68% | |
~217% | |
~157% | |
~131% |
Question 38 |
Answer the question 1 to 5 based on the data given in the table below.
In the year 2001, out of total number of vehicles, the number of passenger vehicles (4 wheelers) accounted for:
In the year 2001, out of total number of vehicles, the number of passenger vehicles (4 wheelers) accounted for:
~24% | |
~31% | |
~43% | |
~14% |
Question 39 |
Answer the question 1 to 5 based on the data given in the table below.
The maximum decadal growth in population of India is registered in the period:
The maximum decadal growth in population of India is registered in the period:
1991 – 2001 | |
2001 – 2011 | |
1981 – 1991 | |
1961 – 1971 |
Question 40 |
Answer the question 1 to 5 based on the data given in the table below.
In which year the decadal growth (%) in number of car surpassed that of the two wheelers?
In which year the decadal growth (%) in number of car surpassed that of the two wheelers?
2001 | |
1981 | |
2011 | |
1991 |
Question 41 |
Consider the following two tables (I and II) that indicate the percentage of employees working in various departments of an organization along with the ratio of men to women in the same departments. The total number of employees in the organization is 4600. Based on these tables I and II, answer the questions that follow (Questions no. 31 – 35):

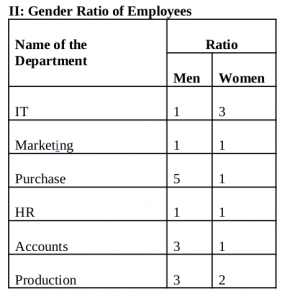
What is the total number of women in the Accounts department?
What is the total number of women in the Accounts department?
86 | |
102 | |
80 | |
92 |
Question 42 |
Consider the following two tables (I and II) that indicate the percentage of employees working in various departments of an organization along with the ratio of men to women in the same departments. The total number of employees in the organization is 4600. Based on these tables I and II, answer the questions that follow (Questions no. 31 – 35):
What is the total number of employees working in the IT and HR departments together ?
What is the total number of employees working in the IT and HR departments together ?
1628 | |
1646 | |
1766 | |
1702 |
Question 43 |
Consider the following two tables (I and II) that indicate the percentage of employees working in various departments of an organization along with the ratio of men to women in the same departments. The total number of employees in the organization is 4600. Based on these tables I and II, answer the questions that follow (Questions no. 31 – 35):
What is the ratio of the total number of men to total number of women working in all the departments put together?
What is the ratio of the total number of men to total number of women working in all the departments put together?
63 : 41 | |
41 : 27 | |
53 : 47 | |
27 : 19 |
Question 44 |
Consider the following two tables (I and II) that indicate the percentage of employees working in various departments of an organization along with the ratio of men to women in the same departments. The total number of employees in the organization is 4600. Based on these tables I and II, answer the questions that follow (Questions no. 31 – 35):
The number of women in the Purchase department forms what percentage of the total number of employees in the organization?
The number of women in the Purchase department forms what percentage of the total number of employees in the organization?
3% | |
6% | |
1% | |
12% |
Question 45 |
Consider the following two tables (I and II) that indicate the percentage of employees working in various departments of an organization along with the ratio of men to women in the same departments. The total number of employees in the organization is 4600. Based on these tables I and II, answer the questions that follow (Questions no. 31 – 35):
What is the ratio of the number of men in the Production department to the number of men in the Marketing department ?
What is the ratio of the number of men in the Production department to the number of men in the Marketing department ?
7 : 3 | |
9 : 11 | |
13 : 7 | |
11 : 9 |
Question 46 |
Among the following, identify the continuous type of data:
Number of languages a person speaks | |
Number of children in a household | |
Population of cities | |
Weight of students in a class |
Question 47 |
The table below embodies data on the sales revenue (Rs. in lakh) generated by a publishing house during the years 2012-15 while selling books, magazines and journals as three categories of items. Answer questions 19 — 21 based on the data contained in the table.
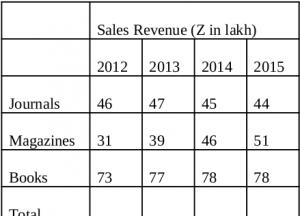
The number of years in which there was an increase in revenue from at least two categories of items, is
The number of years in which there was an increase in revenue from at least two categories of items, is
0 | |
1 | |
2 | |
3 |
Question 48 |
The table below embodies data on the sales revenue (Rs. in lakh) generated by a publishing house during the years 2012-15 while selling books, magazines and journals as three categories of items. Answer questions 19 — 21 based on the data contained in the table.
If the year 2016 were to show the same growth in terms of total sales revenue as the year 2015 over the year 2014, then the revenue in the year 2016 must be approximately:
If the year 2016 were to show the same growth in terms of total sales revenue as the year 2015 over the year 2014, then the revenue in the year 2016 must be approximately:
Rs. 194 lakh | |
Rs. 187 lakh | |
Rs. 172 lakh | |
Rs. 177 lakh |
Question 49 |
The table below embodies data on the sales revenue (Rs. in lakh) generated by a publishing house during the years 2012-15 while selling books, magazines and journals as three categories of items. Answer questions 19 — 21 based on the data contained in the table.
In 2015, approximately what percent of total revenue came from books?
In 2015, approximately what percent of total revenue came from books?
45% | |
55% | |
35% | |
25% |
Question 50 |
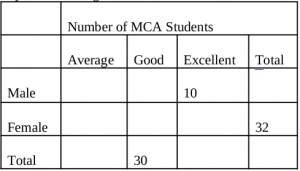
A University professor maintains data on MCA students tabulated by performance and gender of the students. The data is kept on a computer hard disk, but accidently sonic of it is lost because of a computer virus. Only the following could be recovered:
Panic buttons were pressed but to no avail. An expert committee was formed, which decided that the following facts were self evident:
(a) Half the students were either excellent or good.
(b) 40% of the students were females.
(c) One-third of the male students were average.
Answer questions 22 — 24 based on the data given above:
What proportion of female students are good?
0 | |
0.25 | |
0.5 | |
0.75 |
There are 50 questions to complete.