Data-Interpretation
Question 1 |
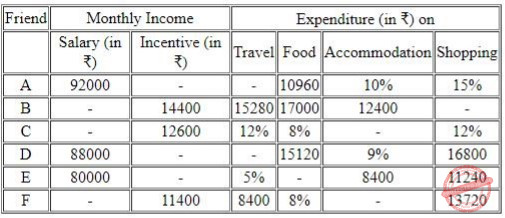
The following table shows the monthly income and various expinditures, of six friends A-F in absolute value or in percentage ( in terms of monthly income) form.
Some values (marked as '-') are missing in the table which you are expected to calculate if required. Based on the data in the table, answer the question:
Income and Expenditure Details
Note:
(a) Monthly Income = Salary + Incentive.
(b) Incentive amounts to 15% of salary.
(c) All six friends save 40% of their monthly income.
(d) There is no expenditure other than those given in the table.
What is the total amount (in ₹ ) spent by all the six friends together on Travelling?
Note:
(a) Monthly Income = Salary + Incentive.
(b) Incentive amounts to 15% of salary.
(c) All six friends save 40% of their monthly income.
(d) There is no expenditure other than those given in the table.
What is the total amount (in ₹ ) spent by all the six friends together on Travelling?
85634 | |
85643 | |
84634 | |
84436 |
Question 2 |
The following table shows the monthly income and various expinditures, of six friends A-F in absolute value or in percentage ( in terms of monthly income) form.
Some values (marked as '-') are missing in the table which you are expected to calculate if required. Based on the data in the table, answer the question:
Income and Expenditure Details
Note:
(a) Monthly Income = Salary + Incentive.
(b) Incentive amounts to 15% of salary.
(c) All six friends save 40% of their monthly income.
(d) There is no expenditure other than those given in the table.
What is the difference in the amount spent by B on Food and Shopping together and that of C on accommodation?
₹ 11,412 | |
₹ 11,532 | |
₹ 11,512 | |
₹ 11,332 |
Question 3 |
The following table shows the monthly income and various expinditures, of six friends A-F in absolute value or in percentage ( in terms of monthly income) form.
Some values (marked as '-') are missing in the table which you are expected to calculate if required. Based on the data in the table, answer the question:
Income and Expenditure Details
Note:
(a) Monthly Income = Salary + Incentive.
(b) Incentive amounts to 15% of salary.
(c) All six friends save 40% of their monthly income.
(d) There is no expenditure other than those given in the table.
What is the amount saved (in ₹) by all the six friends together?
Note:
(a) Monthly Income = Salary + Incentive.
(b) Incentive amounts to 15% of salary.
(c) All six friends save 40% of their monthly income.
(d) There is no expenditure other than those given in the table.
What is the amount saved (in ₹) by all the six friends together?
223760 | |
237360 | |
237630 | |
273360 |
Question 4 |
The following table shows the monthly income and various expinditures, of six friends A-F in absolute value or in percentage ( in terms of monthly income) form.
Some values (marked as '-') are missing in the table which you are expected to calculate if required. Based on the data in the table, answer the question:
Income and Expenditure Details
Note:
(a) Monthly Income = Salary + Incentive.
(b) Incentive amounts to 15% of salary.
(c) All six friends save 40% of their monthly income.
(d) There is no expenditure other than those given in the table.
The annual income of D is ₹ _______ less than that of A.
Note:
(a) Monthly Income = Salary + Incentive.
(b) Incentive amounts to 15% of salary.
(c) All six friends save 40% of their monthly income.
(d) There is no expenditure other than those given in the table.
The annual income of D is ₹ _______ less than that of A.
4600 | |
52300 | |
55200 | |
4900 |
Question 5 |
The following table shows the monthly income and various expinditures, of six friends A-F in absolute value or in percentage ( in terms of monthly income) form.
Some values (marked as '-') are missing in the table which you are expected to calculate if required. Based on the data in the table, answer the question:
Income and Expenditure Details
Note:
(a) Monthly Income = Salary + Incentive.
(b) Incentive amounts to 15% of salary.
(c) All six friends save 40% of their monthly income.
(d) There is no expenditure other than those given in the table.
Expenditure by A on Travelling constitutes approximately _____ % of the salary of F.
Note:
(a) Monthly Income = Salary + Incentive.
(b) Incentive amounts to 15% of salary.
(c) All six friends save 40% of their monthly income.
(d) There is no expenditure other than those given in the table.
Expenditure by A on Travelling constitutes approximately _____ % of the salary of F.
30 | |
38 | |
32 | |
34 |
Question 6 |
The following table shows the percentage (%) distribution of total number of students and total number of girls studying in six colleges A-F. Total number of students and girls studying in all the colleges together are 60000 and 24000 respectively. Based on the data in the table, answer the questions
College-wise Distribution of Students
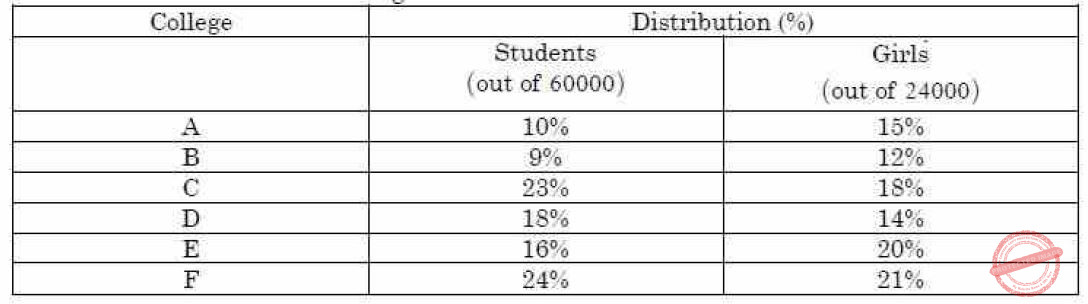
The ratio of the number of boys in College F with the number of boys in college D is
College-wise Distribution of Students
The ratio of the number of boys in College F with the number of boys in college D is
31:39
| |
39:31
| |
29:37
| |
37:29 |
Question 7 |
The following table shows the percentage (%) distribution of total number of students and total number of girls studying in six colleges A-F.Total number of students and girls studying in all the colleges together are 60000 and 24000 respectively. Based on the data in the table, answer the questions
College-wise Distribution of Students
The number of girls in College F is ____ % more than the number of girls in College A
The number of girls in College F is ____ % more than the number of girls in College A
25 | |
30 | |
40 | |
50 |
Question 8 |
The following table shows the percentage (%) distribution of total number of students and total number of girls studying in six colleges A-F.Total number of students and girls studying in all the colleges together are 60000 and 24000 respectively. Based on the data in the table, answer the questions
College-wise Distribution of Students
The difference between the number of boys and number of girls studying in College D is
The difference between the number of boys and number of girls studying in College D is
4040
| |
4080
| |
7440
| |
3360 |
Question 9 |
The following table sh0ws the percentage (%) distribution of total number of students and total number of girls studying in six colleges A-F.Total number of students and girls studying in all the colleges together are 60000 and 24000 respectively. Based on the data in the table, answer the questions
College-wise Distribution of Students
The average of the number of boys studying in Collegs A,B and C is
The average of the number of boys studying in Collegs A,B and C is
4900
| |
4700
| |
4400
| |
4800 |
Question 10 |
The following table shows the percentage (%) distribution of total number of students and total number of girls studying in six colleges A-F.Total number of students and girls studying in all the colleges together are 60000 and 24000 respectively. Based on the data in the table, answer the questions
College-wise Distribution of Students
The number of girl students studying in College C as a percentage of the number of boys studying in College E is
The number of girl students studying in College C as a percentage of the number of boys studying in College E is
70% | |
75% | |
80% | |
90% |
Question 11 |
Study the following graph carefully and answer Q.No. 44 to 49 given below it :
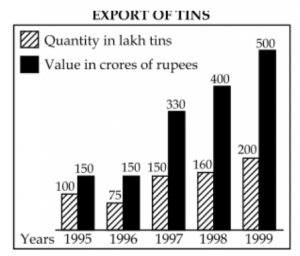
In which year the value per tin was minimum ?
In which year the value per tin was minimum ?
1995 | |
1996 | |
1998 | |
1999 |
Question 12 |
Study the following graph carefully and answer Q.No. 44 to 49 given below it :
What was the difference between the tins exported in 1997 and 1998 ?
What was the difference between the tins exported in 1997 and 1998 ?
10 | |
1000 | |
100000 | |
1000000 |
Question 13 |
Study the following graph carefully and answer Q.No. 44 to 49 given below it :
What was the approximate percentage increase in export value from 1995 to 1999 ?
What was the approximate percentage increase in export value from 1995 to 1999 ?
350 | |
330.3 | |
433.3 | |
None of these |
Question 14 |
Study the following graph carefully and answer Q.No. 44 to 49 given below it :
What was the percentage drop in export quantity from 1995 to 1996 ?
What was the percentage drop in export quantity from 1995 to 1996 ?
75 | |
50 | |
25 | |
None of these |
Question 15 |
Study the following graph carefully and answer Q.No. 44 to 49 given below it :
If in 1998, the tins were exported at the same rate per tin as that in 1997, what would be the value (in crores of rupees) of export in 1998 ?
If in 1998, the tins were exported at the same rate per tin as that in 1997, what would be the value (in crores of rupees) of export in 1998 ?
400 | |
375 | |
352 | |
330 |
Question 16 |
Answer the question 1 to 5 based on the data given in the table below.
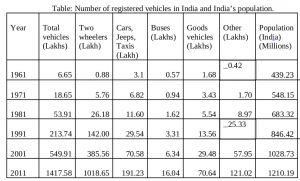
What was the per capita ownership of two wheelers in India in the year 2011?
What was the per capita ownership of two wheelers in India in the year 2011?
~0.0084% | |
~0.84% | |
~0.068% | |
~0.084% | |
None of the Above |
Question 17 |
Answer the question 1 to 5 based on the data given in the table below.
What was the average decadal growth in the number of cars during 1961 – 2011?
What was the average decadal growth in the number of cars during 1961 – 2011?
~68% | |
~217% | |
~157% | |
~131% |
Question 18 |
Answer the question 1 to 5 based on the data given in the table below.
In the year 2001, out of total number of vehicles, the number of passenger vehicles (4 wheelers) accounted for:
In the year 2001, out of total number of vehicles, the number of passenger vehicles (4 wheelers) accounted for:
~24% | |
~31% | |
~43% | |
~14% |
Question 19 |
Answer the question 1 to 5 based on the data given in the table below.
The maximum decadal growth in population of India is registered in the period:
The maximum decadal growth in population of India is registered in the period:
1991 – 2001 | |
2001 – 2011 | |
1981 – 1991 | |
1961 – 1971 |
Question 20 |
Answer the question 1 to 5 based on the data given in the table below.
In which year the decadal growth (%) in number of car surpassed that of the two wheelers?
In which year the decadal growth (%) in number of car surpassed that of the two wheelers?
2001 | |
1981 | |
2011 | |
1991 |
Question 21 |
Consider the following two tables (I and II) that indicate the percentage of employees working in various departments of an organization along with the ratio of men to women in the same departments. The total number of employees in the organization is 4600. Based on these tables I and II, answer the questions that follow (Questions no. 31 – 35):

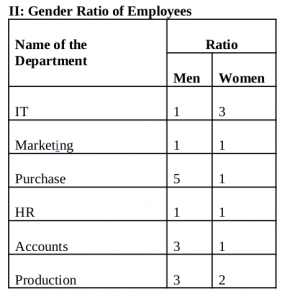
What is the total number of women in the Accounts department?
What is the total number of women in the Accounts department?
86 | |
102 | |
80 | |
92 |
Question 22 |
Consider the following two tables (I and II) that indicate the percentage of employees working in various departments of an organization along with the ratio of men to women in the same departments. The total number of employees in the organization is 4600. Based on these tables I and II, answer the questions that follow (Questions no. 31 – 35):
What is the total number of employees working in the IT and HR departments together ?
What is the total number of employees working in the IT and HR departments together ?
1628 | |
1646 | |
1766 | |
1702 |
Question 23 |
Consider the following two tables (I and II) that indicate the percentage of employees working in various departments of an organization along with the ratio of men to women in the same departments. The total number of employees in the organization is 4600. Based on these tables I and II, answer the questions that follow (Questions no. 31 – 35):
What is the ratio of the total number of men to total number of women working in all the departments put together?
What is the ratio of the total number of men to total number of women working in all the departments put together?
63 : 41 | |
41 : 27 | |
53 : 47 | |
27 : 19 |
Question 24 |
Consider the following two tables (I and II) that indicate the percentage of employees working in various departments of an organization along with the ratio of men to women in the same departments. The total number of employees in the organization is 4600. Based on these tables I and II, answer the questions that follow (Questions no. 31 – 35):
The number of women in the Purchase department forms what percentage of the total number of employees in the organization?
The number of women in the Purchase department forms what percentage of the total number of employees in the organization?
3% | |
6% | |
1% | |
12% |
Question 25 |
Consider the following two tables (I and II) that indicate the percentage of employees working in various departments of an organization along with the ratio of men to women in the same departments. The total number of employees in the organization is 4600. Based on these tables I and II, answer the questions that follow (Questions no. 31 – 35):
What is the ratio of the number of men in the Production department to the number of men in the Marketing department ?
What is the ratio of the number of men in the Production department to the number of men in the Marketing department ?
7 : 3 | |
9 : 11 | |
13 : 7 | |
11 : 9 |
Question 26 |
The table below embodies data on the sales revenue (Rs. in lakh) generated by a publishing house during the years 2012-15 while selling books, magazines and journals as three categories of items. Answer questions 19 — 21 based on the data contained in the table.
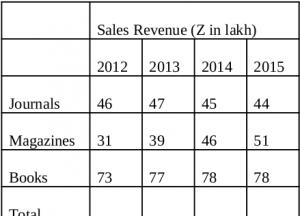
The number of years in which there was an increase in revenue from at least two categories of items, is
The number of years in which there was an increase in revenue from at least two categories of items, is
0 | |
1 | |
2 | |
3 |
Question 27 |
The table below embodies data on the sales revenue (Rs. in lakh) generated by a publishing house during the years 2012-15 while selling books, magazines and journals as three categories of items. Answer questions 19 — 21 based on the data contained in the table.
If the year 2016 were to show the same growth in terms of total sales revenue as the year 2015 over the year 2014, then the revenue in the year 2016 must be approximately:
If the year 2016 were to show the same growth in terms of total sales revenue as the year 2015 over the year 2014, then the revenue in the year 2016 must be approximately:
Rs. 194 lakh | |
Rs. 187 lakh | |
Rs. 172 lakh | |
Rs. 177 lakh |
Question 28 |
The table below embodies data on the sales revenue (Rs. in lakh) generated by a publishing house during the years 2012-15 while selling books, magazines and journals as three categories of items. Answer questions 19 — 21 based on the data contained in the table.
In 2015, approximately what percent of total revenue came from books?
In 2015, approximately what percent of total revenue came from books?
45% | |
55% | |
35% | |
25% |
Question 29 |
A University professor maintains data on MCA students tabulated by performance and gender of the students. The data is kept on a computer hard disk, but accidently sonic of it is lost because of a computer virus. Only the following could be recovered:
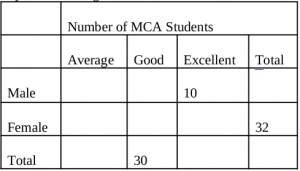
Panic buttons were pressed but to no avail. An expert committee was formed, which decided that the following facts were self evident:
(a) Half the students were either excellent or good.
(b) 40% of the students were females.
(c) One-third of the male students were average.
Answer questions 22 — 24 based on the data given above:
What proportion of female students are good?
0 | |
0.25 | |
0.5 | |
0.75 |
Question 30 |
A University professor maintains data on MCA students tabulated by performance and gender of the students. The data is kept on a computer hard disk, but accidently sonic of it is lost because of a computer virus. Only the following could be recovered:
Panic buttons were pressed but to no avail. An expert committee was formed, which decided that the following facts were self evident:
(a) Half the students were either excellent or good.
(b) 40% of the students were females.
(c) One-third of the male students were average.
Answer questions 22 — 24 based on the data given above:
Approximately, what proportion of good students are male?
0 | |
0.73 | |
0.43 | |
0.27 |
Question 31 |
A University professor maintains data on MCA students tabulated by performance and gender of the students. The data is kept on a computer hard disk, but accidently sonic of it is lost because of a computer virus. Only the following could be recovered:
Panic buttons were pressed but to no avail. An expert committee was formed, which decided that the following facts were self evident:
(a) Half the students were either excellent or good.
(b) 40% of the students were females.
(c) One-third of the male students were average.
Answer questions 22 — 24 based on the data given above:
How many female students are excellent?
0 | |
8 | |
16 | |
32 |
Question 32 |
Given below in the table is the decadal data of Population and Electrical Power Production of a country.
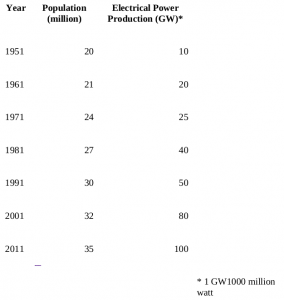
Based on the above table, answer the questions from Sl. No. 37 to 42.
Which decade registered the maximum growth rate (%) of population?
Based on the above table, answer the questions from Sl. No. 37 to 42.
Which decade registered the maximum growth rate (%) of population?
1961-71 | |
1971-81 | |
1991-2001 | |
2001-2011 |
Question 33 |
Given below in the table is the decadal data of Population and Electrical Power Production of a country.
Based on the above table, answer the questions from Sl. No. 37 to 42.
Average decadal growth rate (%) of population is:
Based on the above table, answer the questions from Sl. No. 37 to 42.
Average decadal growth rate (%) of population is:
~12.21% | |
~9.82% | |
~6.73% | |
~5% |
Question 34 |
Given below in the table is the decadal data of Population and Electrical Power Production of a country.
Based on the above table, answer the questions from Sl. No. 37 to 42.
Based on the average decadal growth rate, what will be the population in the year 2021?
Based on the above table, answer the questions from Sl. No. 37 to 42.
Based on the average decadal growth rate, what will be the population in the year 2021?
40.34 million | |
38.49 million | |
37.28 million | |
36.62 million |
Question 35 |
Given below in the table is the decadal data of Population and Electrical Power Production of a country.
Based on the above table, answer the questions from Sl. No. 37 to 42.
In the year 1951, what was the power availability per person?
Based on the above table, answer the questions from Sl. No. 37 to 42.
In the year 1951, what was the power availability per person?
100 W | |
200 W | |
400 W | |
500 W |
Question 36 |
Given below in the table is the decadal data of Population and Electrical Power Production of a country.
Based on the above table, answer the questions from Sl. No. 37 to 42.
In which decade, the average power availability per person was maximum?
Based on the above table, answer the questions from Sl. No. 37 to 42.
In which decade, the average power availability per person was maximum?
1981-1991 | |
1991-2001 | |
2001-2011 | |
1971-1981 |
Question 37 |
Given below in the table is the decadal data of Population and Electrical Power Production of a country.
Based on the above table, answer the questions from Sl. No. 37 to 42.
By what percentage (%) the power production increased from 1951 o 2011?
Based on the above table, answer the questions from Sl. No. 37 to 42.
By what percentage (%) the power production increased from 1951 o 2011?
100% | |
300% | |
600% | |
900% |
There are 37 questions to complete.