Higher-Education-and-Politics
March 6, 2025Venn-Diagram
March 7, 2025Data-Interpretation
|
Question 51
|
Given below in the table is the decadal data of Population and Electrical Power Production of a country.
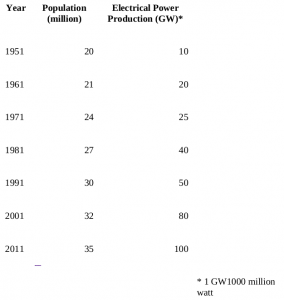
Based on the above table, answer the questions from Sl. No. 37 to 42.
Based on the above table, answer the questions from Sl. No. 37 to 42.
By what percentage (%) the power production increased from 1951 o 2011?
|
100%
|
|
|
300%
|
|
|
600%
|
|
|
900%
|
Correct Answer: D